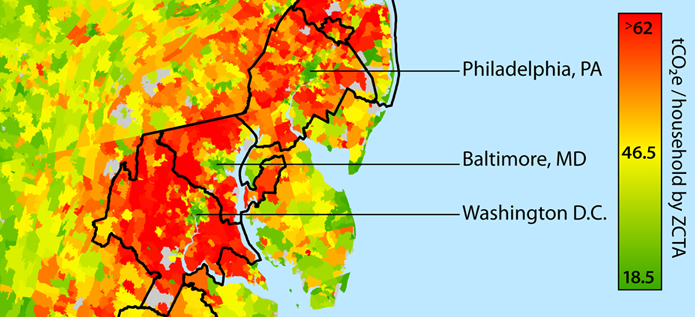
Red areas on the map above show high carbon dioxide emissions associated with sprawl development in our region.
Nature Forward supported Montgomery County’s new Thrive 2050 (while pressing for needed improvements) because of the regionwide benefits of fighting sprawl with development that keeps housing and business growth centered near transit and away from the forests and farms of the Agricultural Reserve and further-out counties. The map above, produced in 2013 by researchers at UC Berkeley, shows the household carbon footprint by Zip Code Tabulation Areas (ZCTA). For our metropolitan region, the urban core, including close-in suburbs and small outlying cities, have low household carbon emissions shown in green on the map. But most of the suburbs and exurbs have much higher emissions. The study found that, “Dominated by emissions from cars, trucks and other forms of transportation, suburbs account for about 50 percent of all household emissions – largely carbon dioxide – in the United States.” While we must be careful to protect natural areas and manage stormwater in all communities to accelerate our fight against climate change, we must reimagine our transportation and development patterns. Nature Forward will fight for policies that keep development where it belongs – close to transit.
Read more about Nature Forward’s position on Thrive 2050.
Image and Research Source: UC Berkeley CoolClimate Network, Average Annual Household Carbon Footprint (2013).
This post first appeared in the Winter 2022-2023 Naturalist Quarterly.
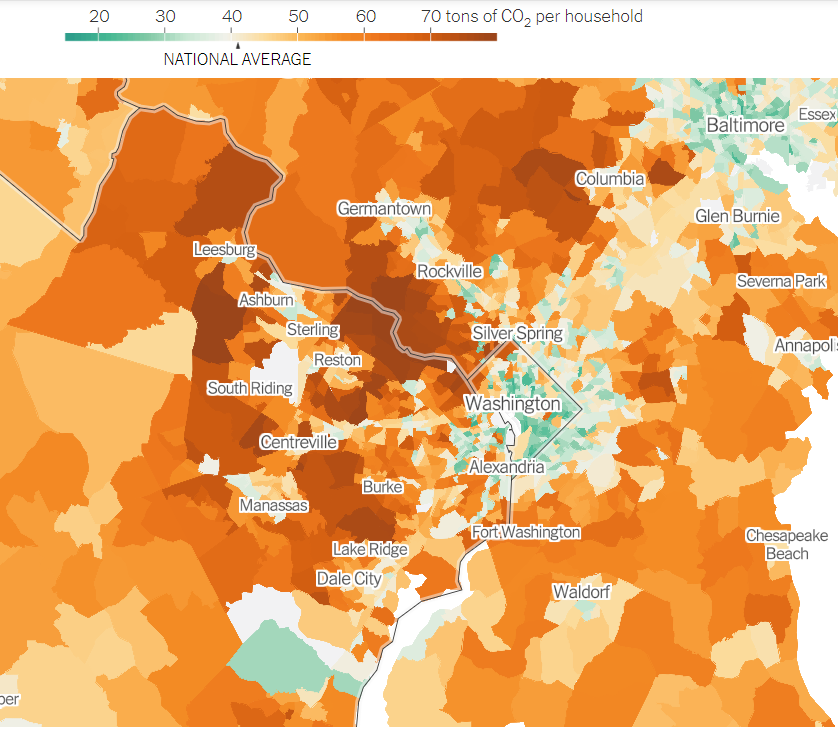
UPDATE: On December 12, 2022, the New York Times published an updated analysis of the CoolClimate dataset, produced by EcoDataLab. The new data (image on left) confirms what the older analysis shows. Read more about how our location and wealth contribute to carbon emissions, and why those patterns exist and persist, here: New York Times gift article link.